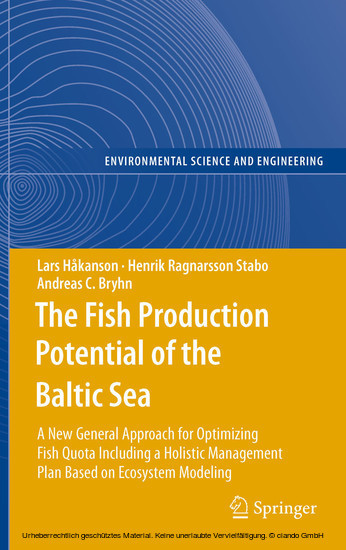
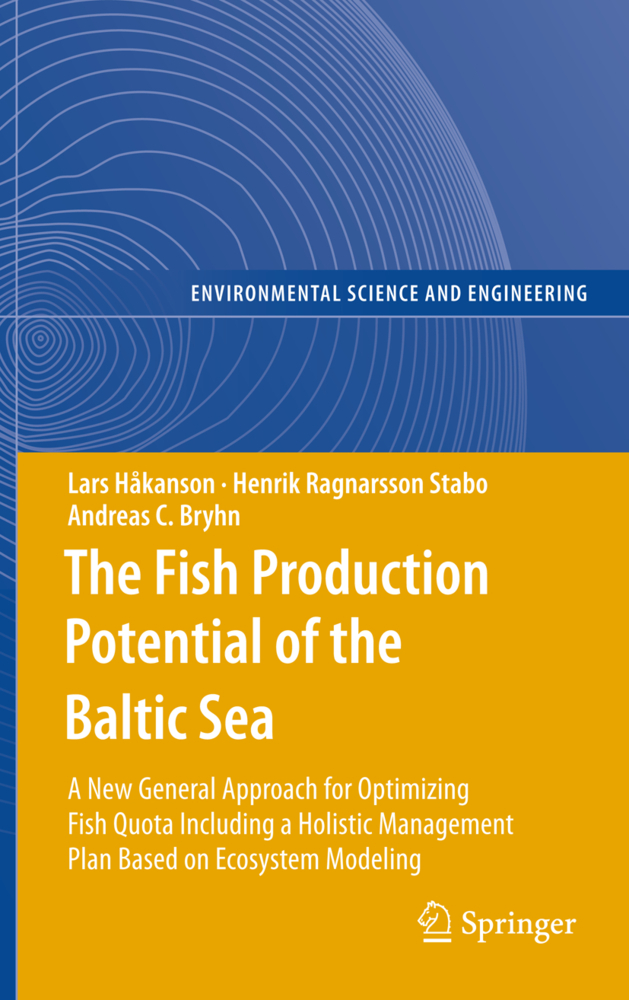
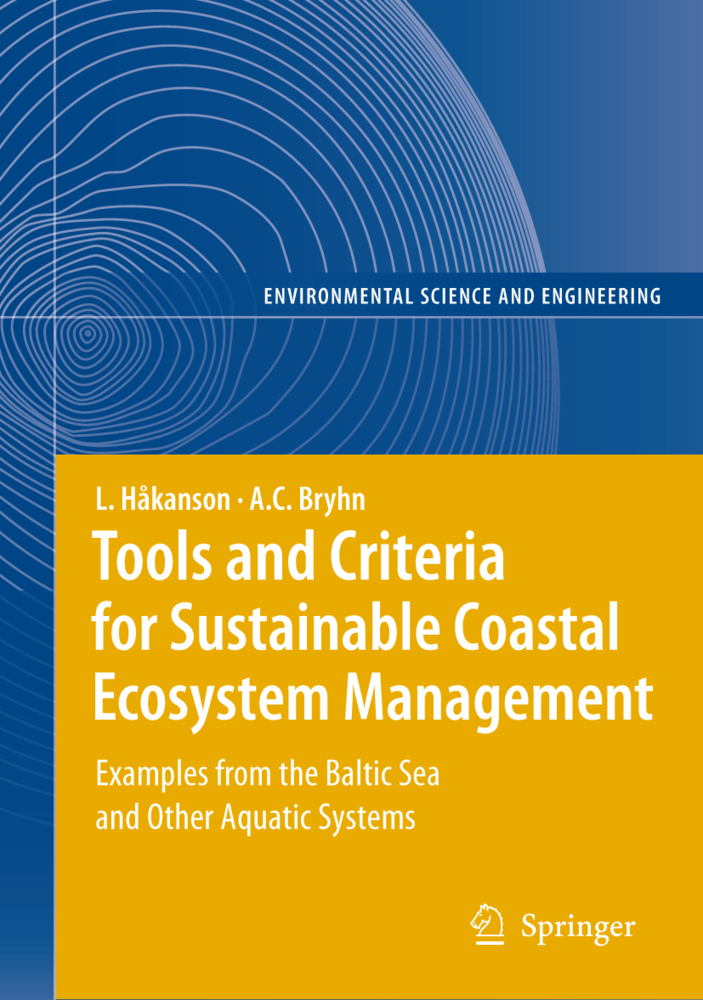
The Fish Production Potential of the Baltic Sea
A New General Approach for Optimizing Fish Quota Including a Holistic Management Plan Based on Ecosystem Modelling
It presents a new approach to set fish quota based on holistic ecosystem modeling (the CoastWeb-model) and also a plan to optimize a sustainable management of the Baltic Sea including a cost-benefit analysis. This plan accounts for the production of prey and predatory fish under different environmental conditions, professional fishing, recreational fishing and fish cage farm production plus an analysis of associated economic values. Several scenarios and remedial strategies for Baltic Sea management are discussed and an 'optimal' strategy motivated and presented, which challenges the HELCOM strategy that was accepted by the Baltic States in November 2007. The strategy advocated in this book would create more than 7000 new jobs, the total value of the fish production would be about 1600 million euro per year plus 1000 million euro per year related to the willingness-to-pay to combat the present conditions in the Baltic Sea. Our strategy would cost about 370 million euro whereas the HELCOM strategy would cost about 3100 million euro per year. The 'optimal' strategy is based on a defined goal - that the water clarity in the Gulf of Finland should return to what it was 100 years ago.
1;Contents;6 2;Prologue;10 3;1 Introduction, Background and Aim;12 4;2 Basic Information on the Baltic Sea;32 4.1;2.1 Introduction and Aim;32 4.2;2.2 Morphometric Data and Criteria for the Vertical Layers;34 4.2.1;2.2.1 Size and Form Characteristics of the Sub-basins;37 4.2.2;2.2.2 Sediments and Bottom Dynamic Conditions;42 4.2.3;2.2.3 The Role of Land Uplift;43 4.3;2.3 Water Exchange and Water Transport in the Baltic Sea;46 4.3.1;2.3.1 Background on Mass-Balances for Salt and the Role of Salinity;46 4.3.2;2.3.2 Water Fluxes;50 4.3.3;2.3.3 Comments;53 4.4;2.4 Phosphorus Dynamics in the Baltic Sea;53 4.4.1;2.4.1 Background on CoastMab for Phosphorus and Nutrient Fluxes to the Baltic Sea;53 4.4.2;2.4.2 Why Not Model N?;56 4.4.3;2.4.3 Phosphorus Modeling in CoastMab;59 4.4.3.1;2.4.3.1 New Features in the Phosphorus Modeling;60 4.4.3.2;2.4.3.2 Empirical Data Versus Modeled Values;68 4.4.3.3;2.4.3.3 Phosphorus Fluxes;70 4.5;2.5 Production and Sedimentation of Particles CoastMab for SPM;75 4.5.1;2.5.1 Basic Structure;75 4.5.2;2.5.2 Primary Production of SPM;77 4.5.3;2.5.3 Inflow of SPM from the Sea and from Tributaries;77 4.5.4;2.5.4 Sedimentation;78 4.5.4.1;2.5.4.1 SPM Influences on Sedimentation;80 4.5.4.2;2.5.4.2 Influences of Salinity on Sedimentation;80 4.5.4.3;2.5.4.3 Influences of the Potential Turbulence on Sedimentation;81 4.5.4.4;2.5.4.4 The Resuspended Fraction and the ''Clay'' Effects;82 4.5.5;2.5.5 Resuspension;83 4.5.6;2.5.6 Mixing;85 4.5.7;2.5.7 Mineralization;86 4.5.8;2.5.8 SPM Outflow;89 4.5.9;2.5.9 The Panel of Driving Variables;89 4.5.10;2.5.10 Testing of Model Predictions;89 4.5.11;2.5.11 SPM-Fluxes and Amounts;96 4.5.12;2.5.12 Comments;100 4.6;2.6 Predicting Chlorophyll-a Concentrations;101 4.7;2.7 Predicting Water Clarity and Secchi Depth;103 4.8;2.8 Trends in Nutrient, Chlorophyll and Oxygen Concentrations;105 4.8.1;2.8.1 Background and Aim;106 4.8.2;2.8.2 Trends in Chlorophyll and Phosphorus Concentrations and the Dissolved Fraction for Phosphorus;107 4.8.3;2.8.3 Trends in Oxygen and Nitrogen Concentrations;111 4.8.4;2.8.4 Trends in Total Phosphorus and Freshwater Inflow from the Catchment;115 4.8.5;2.8.5 Comments;117 4.8.6;2.8.6 Trends in Ice Cover, Water Temperatures and Comments Related to Sediment Resuspension;119 4.8.6.1;2.8.6.1 Background;119 4.8.6.2;2.8.6.2 Ice Conditions;120 4.8.6.3;2.8.6.3 Temperatures;122 4.8.6.4;2.8.6.4 Concluding Comments;125 4.9;2.9 Background on Flora and Fauna of the Baltic Sea;127 4.9.1;2.9.1 The Fish Community;129 4.9.1.1;2.9.1.1 The Important Species and Functional Groups;132 4.10;2.10 Conclusions;138 5;3 The CoastWeb-Model Structures and Set-Up;142 5.1;3.1 Introduction and Aim;142 5.1.1;3.1.1 Key Biotic Parts and Concepts;142 5.2;3.2 A Brief Comparison with Other Foodweb Models;146 5.3;3.3 General Outline of CoastWeb;149 5.3.1;3.3.1 Basic Mathematical Structure of Each Unit;151 5.3.2;3.3.2 Primary Units;151 5.3.3;3.3.3 Secondary Production Units;160 5.3.4;3.3.4 Target Variables in CoastWeb;163 5.3.5;3.3.5 Panel of Driving Variables;166 5.4;3.4 Modified Features;166 5.4.1;3.4.1 Predictions of Normal Biomasses of the Functional Groups;167 5.4.2;3.4.2 Migration In and Out of Coastal Areas;170 5.4.3;3.4.3 Jellyfish;180 5.4.4;3.4.4 Fishing;184 5.4.5;3.4.5 Minor Modifications;185 5.5;3.5 Concluding Comments;188 6;4 Modeling of the Different Functional Groups;190 6.1;4.1 Introduction, Aim and Set-Up;190 6.2;4.2 Primary Producers;193 6.2.1;4.2.1 Phytoplankton -- Background;193 6.2.2;4.2.2 Modeling of Phytoplankton;194 6.2.3;4.2.3 Testing Modeling Results;196 6.2.3.1;4.2.3.1 Reductions in TP-Loading;197 6.2.3.2;4.2.3.2 Increasing Salt-Water Inflow;200 6.2.3.3;4.2.3.3 Temperature Scenario;202 6.2.4;4.2.4 Benthic Algae;205 6.2.4.1;4.2.4.1 Modeling of Benthic Algae;207 6.2.4.2;4.2.4.2 Testing Modeling Results;212 6.2.5;4.2.5 Macrophytes;215 6.2.5.1;4.2.5.1 Background on Macrophytes;215 6.2.5.2;4.2.5.2 Modeling of Macrophytes;216 6.2.5.3;4.2.5.3 Testing Modeling Results;219 6.3;4.3 Th
Håkanson, Lars
Ragnarsson Stabo, Henrik
Bryhn, Andreas C.
| ISBN | 9783642115622 |
|---|---|
| Artikelnummer | 9783642115622 |
| Medientyp | E-Book - PDF |
| Auflage | 2. Aufl. |
| Copyrightjahr | 2010 |
| Verlag | Springer-Verlag |
| Umfang | 396 Seiten |
| Sprache | Englisch |
| Kopierschutz | Digitales Wasserzeichen |

